php.net |  support |  documentation |  report a bug |  advanced search |  search howto |  statistics |  random bug |  login

Unix | Windows

Generating a backtrace, with a compiler, on Windows

You'll need to install MS Visual Studio 2008, 2012 or later. You'll also need to

  • either download the debug-pack for your PHP version from windows.php.net/download
  • or compile your own PHP with --enable-dbg-pack or --enable-debug

If you downloaded the debug-pack from the snaps site, extract it into your PHP directory and be sure to put the PDB files that belong to the extensions into your extension directory.

If you compile PHP by your own, you can also use a newer version of MSVC.

When PHP crashes, click Cancel to debug the process. Now MSVC starts up in Debug View. If you don't already see the call stack, go into the View menu and choose Debug WindowsCall Stack.

You'll now see something similar to the following lines, this is the backtrace:


_efree(void * 0x00000000) line 286 + 3 bytes
zif_http_test(int 0, _zval_struct * 0x007bc3b0, _zval_struct * * 0x00000000, _zval_struct * 0x00000000, int 0, void * * * 0x00792cd0) line 1685 + 8 bytes
zend_do_fcall_common_helper_SPEC(_zend_execute_data * 0x0012fd6c, void * * * 0x00792cd0) line 188 + 95 bytes
ZEND_DO_FCALL_SPEC_CONST_HANDLER(_zend_execute_data * 0x0012fd6c, void * * * 0x00792cd0) line 1578 + 13 bytes
execute(_zend_op_array * 0x007bc880, void * * * 0x00792cd0) line 88 + 13 bytes
zend_eval_string(char * 0x00793bce, _zval_struct * 0x00000000, char * 0x00404588 tring', void * * * 0x00792cd0) line 1056 + 14 bytes
zend_eval_string_ex(char * 0x00793bce, _zval_struct * 0x00000000, char * 0x00404588 tring', int 1, void * * * 0x00792cd0) line 1090 + 21 bytes
main(int 3, char * * 0x00793ba8) line 1078 + 23 bytes
PHP! mainCRTStartup + 227 bytes
KERNEL32! 77e81af6()

Generating backtrace, without compiler, on Windows

Generating a backtrace without compiler is usually a two step process:

  • Generate a crash dump file (.dmp)
  • Analyze the crash dump file to get a stack backtrace

There are several solutions for either step; in the following we describe one solution each.

Use ProcDump to generate crash dump files

Download ProcDump, and register it as the Just-in-Time (AeDebug) debugger:

procdump -ma -i C:\dumps

Use any suitable folder to store the crash dump files instead of C:\dumps. Whenever a process crashes, a crash dump file will be written to the specified folder.

Use Debug Diagnostic Tool to analyze the crash dump

  • Download and install Debug Diagnostic Tool
  • Download and unpack the PHP debug pack corresponding to the PHP version you are running
  • Start the Debug Diagnostic Tool
  • Add the path to the unpacked PHP debug pack as symbol search path in the settings
  • Press "add data file" and select the crash dump file formerly generated
  • Select "default analysis"
  • Press "start analysis"

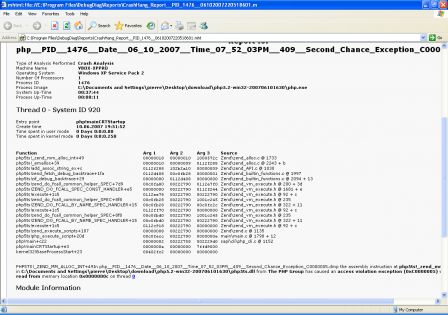
After the analysis has finished, the DebugDiag Analysis Report opens in Internet Explorer; the relevant part of that report is the stack backtrace, which looks similar to the following:

Debug report backtrace screenshot

 
PHP Copyright © 2001-2024 The PHP Group
All rights reserved.
Last updated: Sat Apr 27 09:01:29 2024 UTC